Not just weather.
Operational intelligence
for your assets.
Velox turns climate signals into asset decisions — a health score, three drivers, one action. For hotels, telecom operators, energy infrastructure and insurers across every climate zone.
Hotels — know your guest comfort score before your guests complain. CCI, CDI and heat stress scored hourly.
Telecom operators — replace 60%+ of diesel consumption. Monitor sandstorm, lightning and wind risk around every BTS tower.
Insurers & risk managers — parametric feeds, WRI and FRI indices updated hourly. Ground-truth data, not just models.
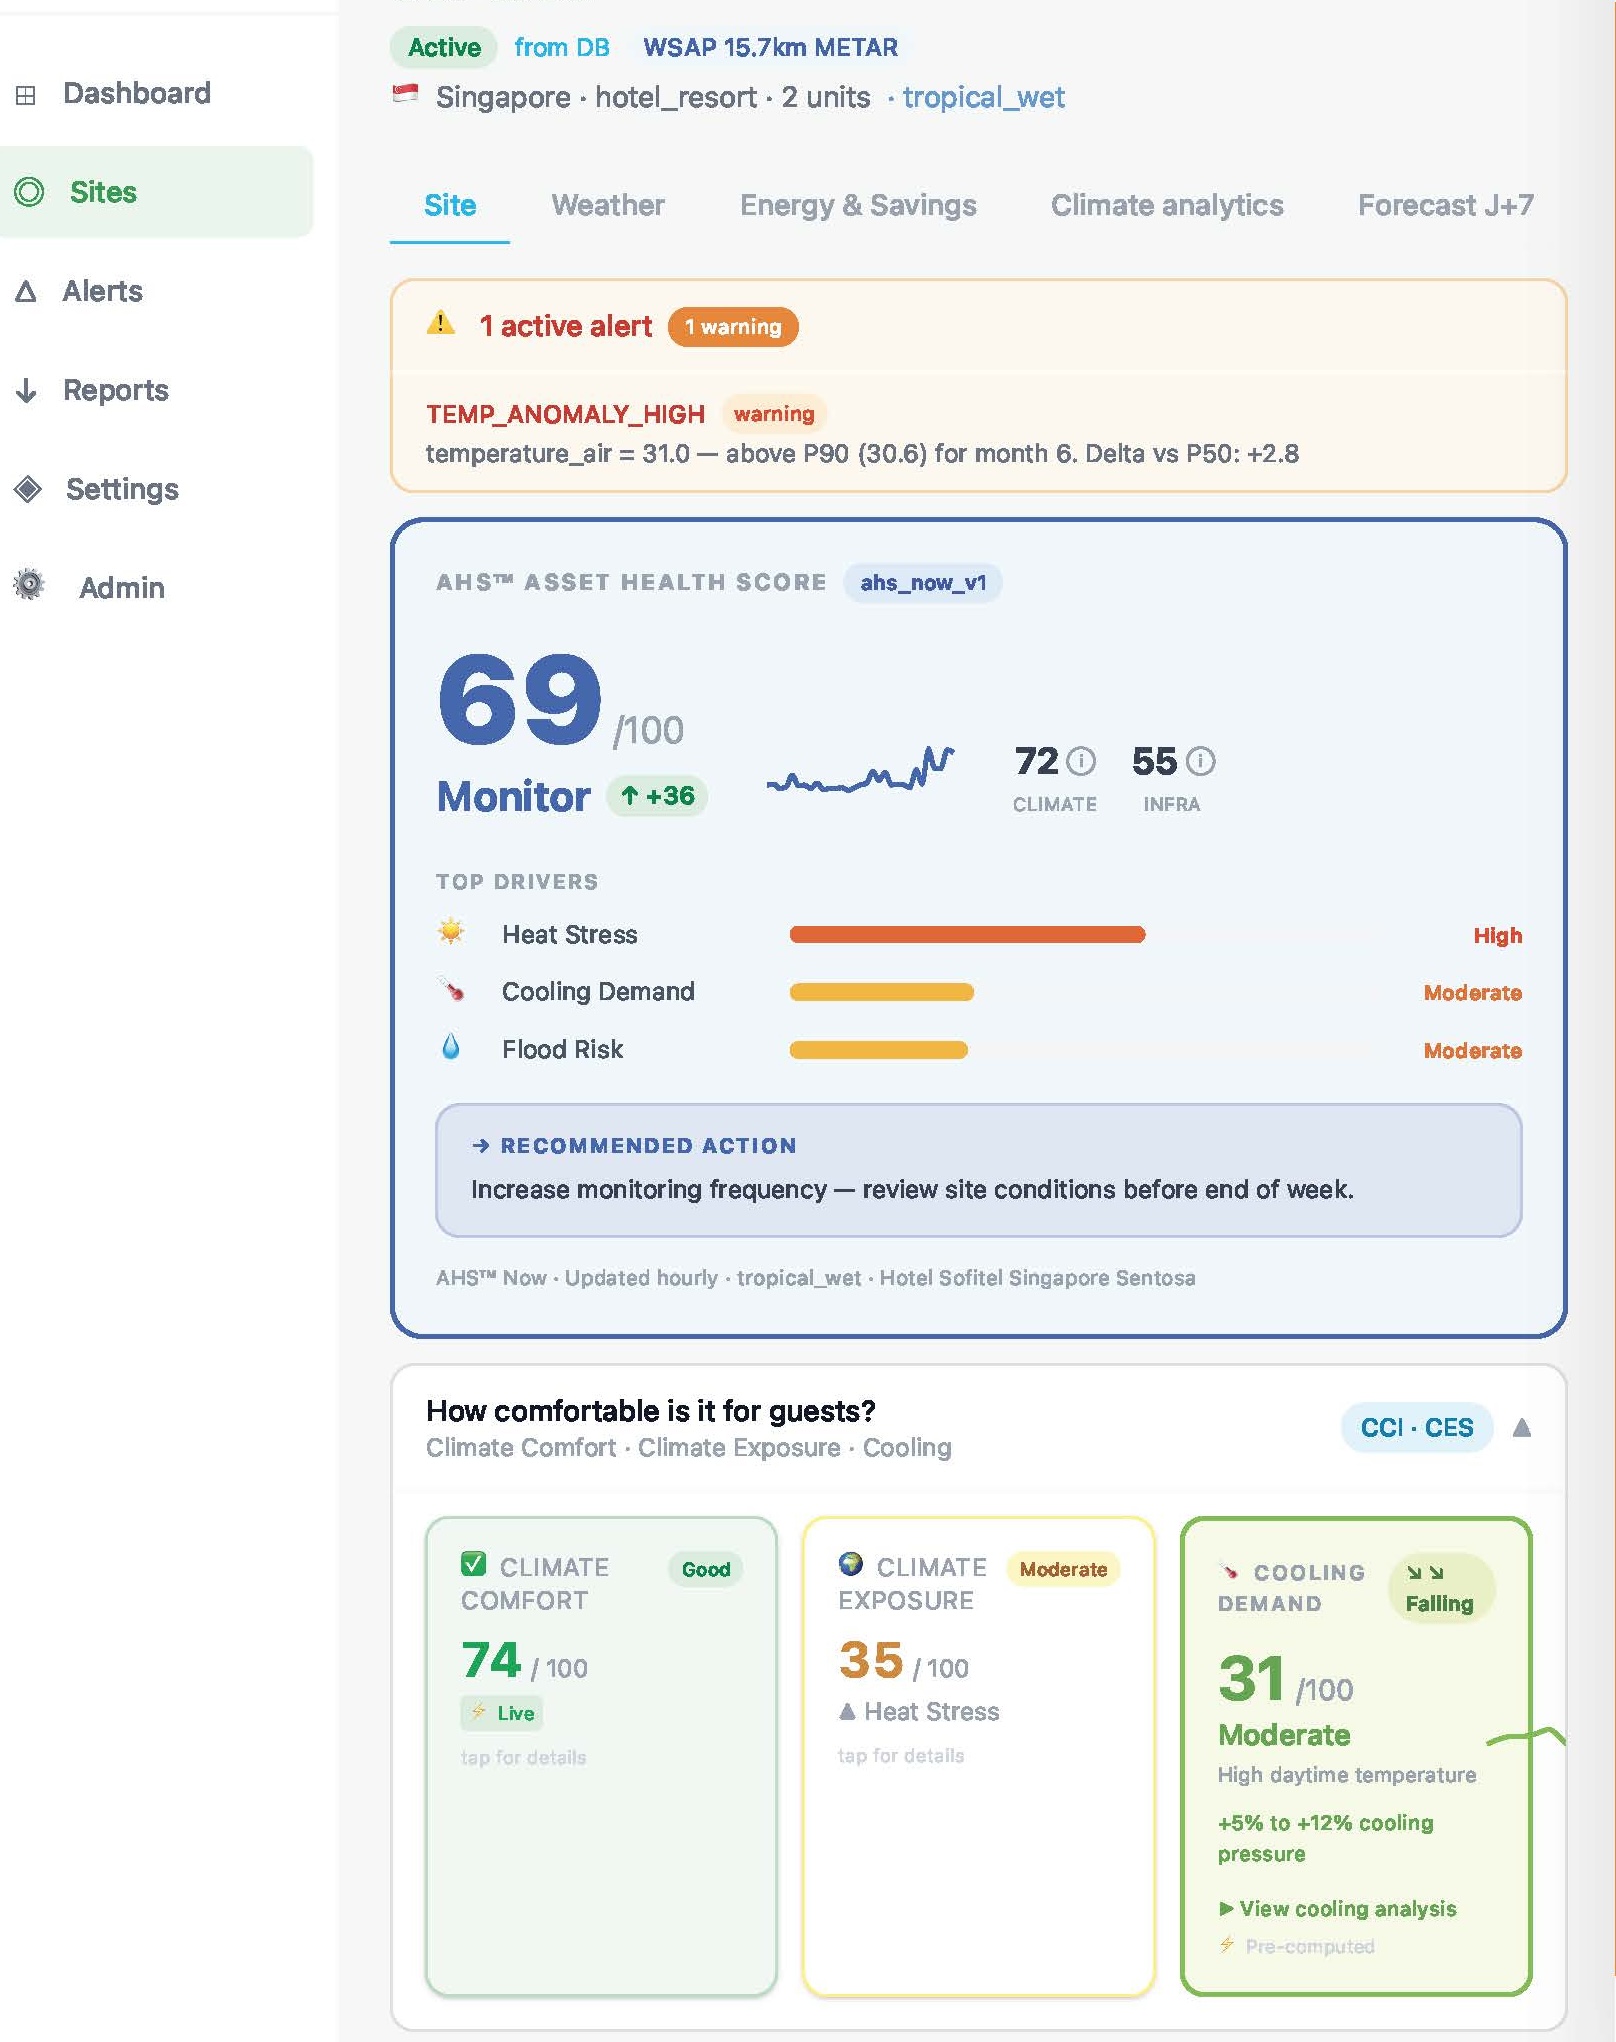
A score for every operational question.
Every Velox score answers a question a non-technical manager asks every morning. Not meteorological indices — operational intelligence, updated hourly, calibrated to your asset type and climate zone.
"Is my asset healthy right now?"
"How comfortable is it for my guests?"
"How resilient is my energy supply?"
"How exposed is this location to climate?"
"How much cooling pressure in the next 7 days?"
"How much energy cost am I avoiding?"
"How sustainable is my operation?"
"What is the wildfire risk for this zone?"
Also includes FRI™ Flood Risk, GCRS™ Guest Comfort Risk, GGI™ Green Guest Impact, and regional indices — Sirocco, Sandstorm, Cut-out risk and more. Pre-configured per vertical.
Explore all scores & indices
The more we collect,
the smarter it gets.
Every sensor reading, every alert, every anomaly detected enriches our models — automatically. Velox combines proprietary ground-truth data with external sources to train predictive models that improve continuously.
 Built on Google Cloud · Vertex AI · BigQuery
From a hotel in Singapore, to a warehouse in Seattle or a BTS tower in Lagos.
The same platform. Configured for your vertical.
Guest comfort scored hourly with CCI™ and CDI. Know your cooling pressure 7 days ahead — before it hits your energy bill.
62%+ diesel replacement monitored in real time. Sandstorm, lightning and wind risk scored around every tower — act before the outage, not after.
WRI, FRI and CES indices updated hourly from ground sensors. Parametric feeds, historical ERA5 and zone-level scoring — ready for your models.
Our sensors are where your assets are.
Unlike pure-software competitors, Velox operates a growing physical network of climate sensors deployed across critical infrastructure zones worldwide. Ground-truth data — not just model interpolation.
Built for operators, not just analysts.
Every vertical gets a pre-configured profile — the right scores, the right alerts, the right actions.
Two types of clients. One platform.
Whether you operate physical infrastructure or need climate intelligence for a territory, Velox has a plan built for you.
You operate physical assets with Velox hardware.
Hotels, telecom towers, retail sites, aerodromes, humanitarian operations — your Velox infrastructure (Aeroleaf, WindBush, WindPalm) feeds real-time energy and climate data into the platform. You get asset health scoring, energy resilience, guest comfort indices and full climate risk analysis — all in one dashboard.
You need climate intelligence for a territory or portfolio.
Insurers, reinsurers, risk managers, municipalities, investors — no hardware needed. Define your monitoring zones (up to 5km radius), choose your alert types, and get hourly climate risk scores for any location on earth. API access available.
From your hotel in Singapore
to your BTS tower in Lagos.
Request a personalised demo. We will show you the platform on your specific assets, geographies and risk perils — within 48 hours.