Climate intelligence your team
can use today. No code required.
From a wind station in Brazil to a BTS tower in Ethiopia — one platform, configured for your vertical. Asset health scores, energy production tracking, climate risk indices and ESG-ready reports. Live on any device.
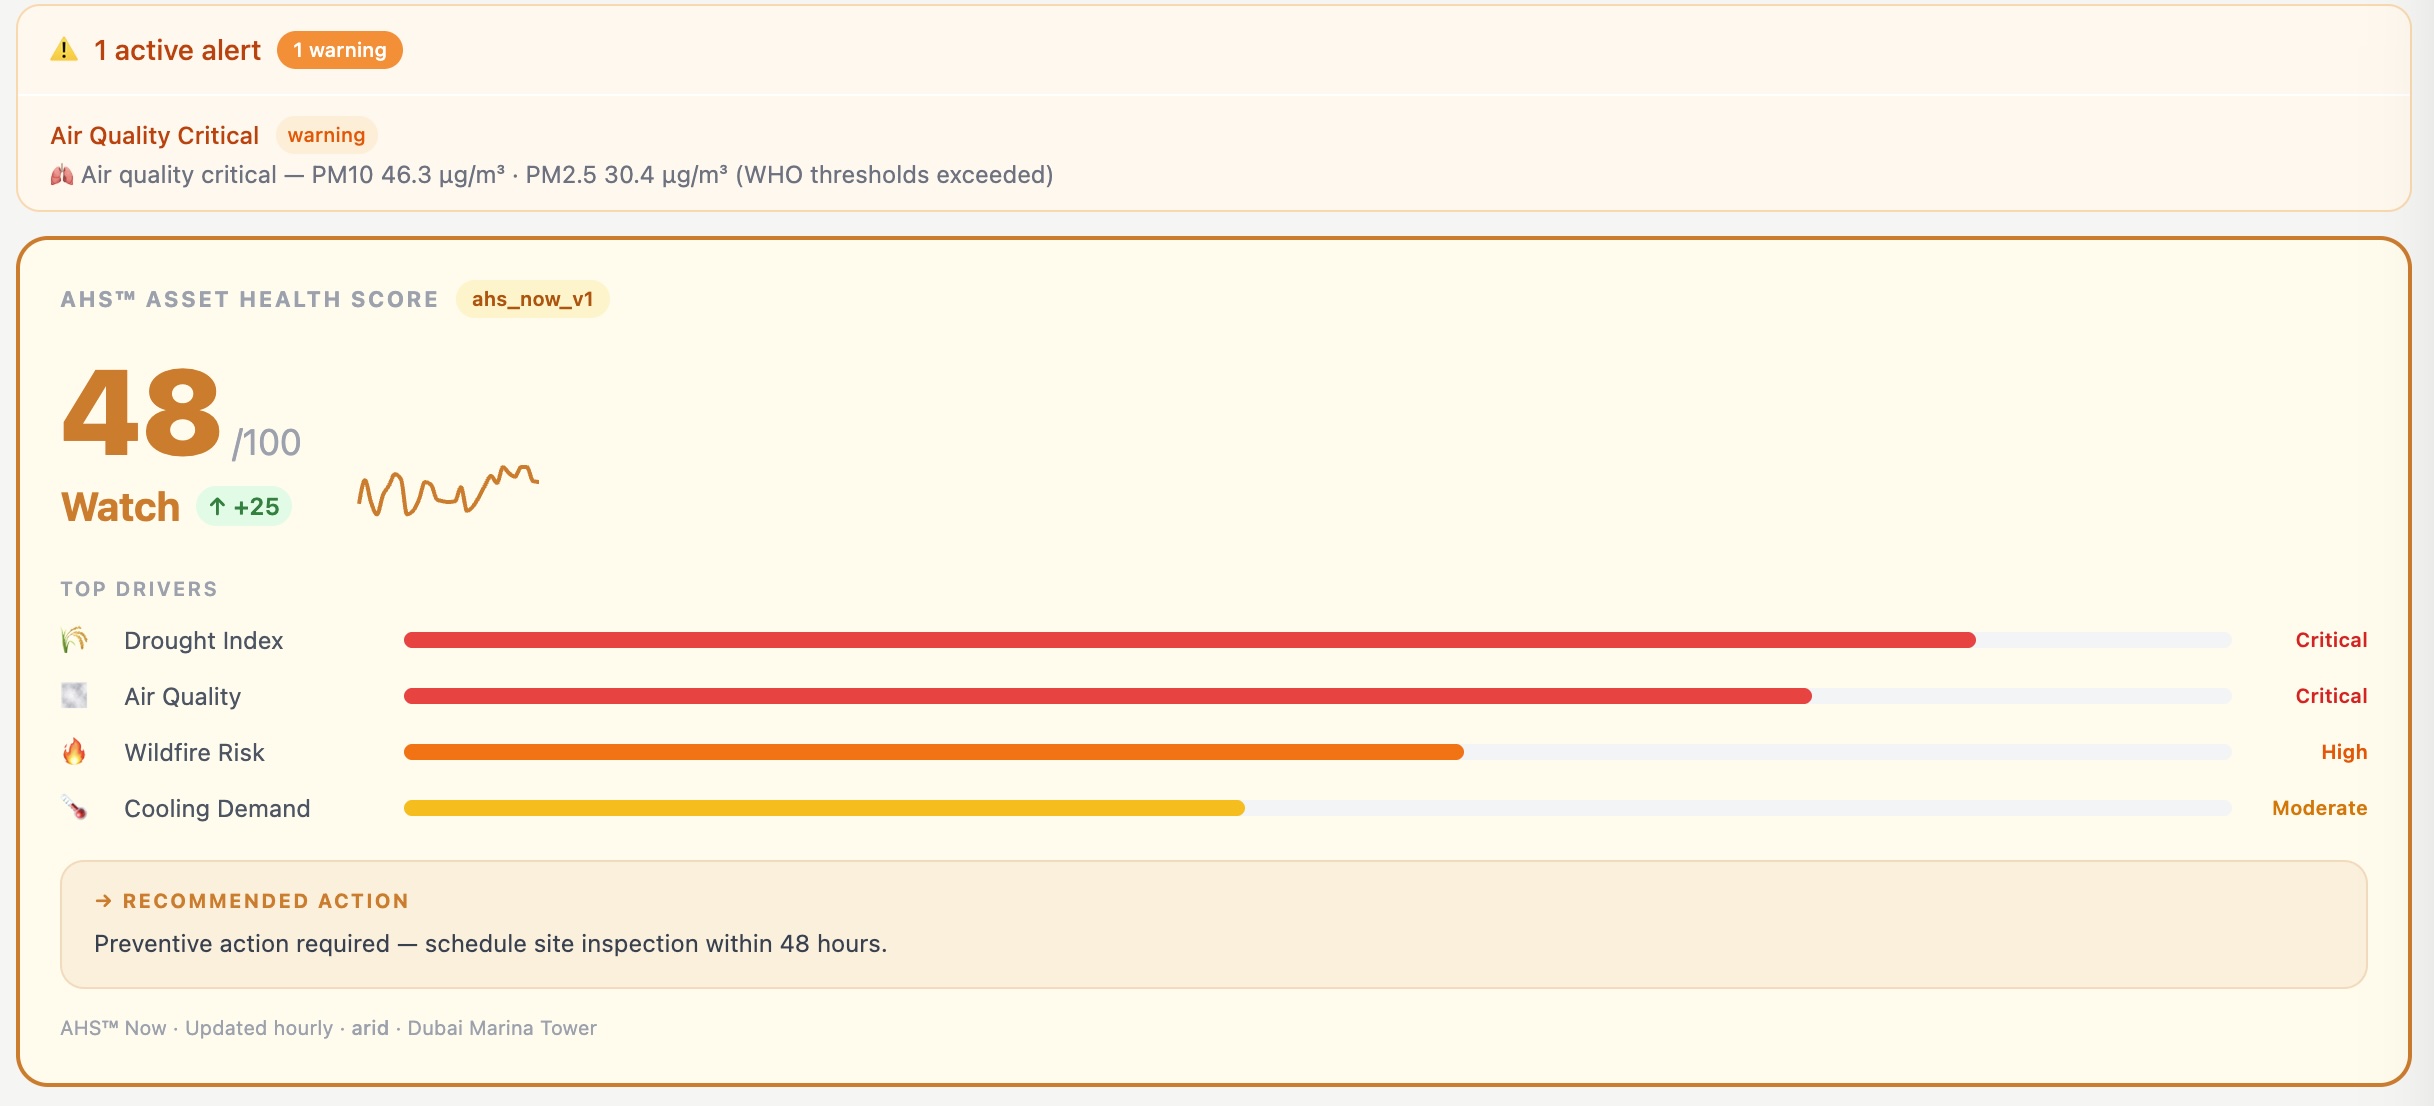
AHS™ · Dubai Marina Tower · arid · Updated hourly
All intelligence starts from Velox physical sensor nodes deployed on-site — temperature, humidity, wind, rainfall, irradiance, air quality. METAR, Google Earth Engine and ERA5 data enrich and calibrate the indices. Powered by Google Cloud Vertex AI.
Production. CO₂. Diesel avoided.
All in one tab.
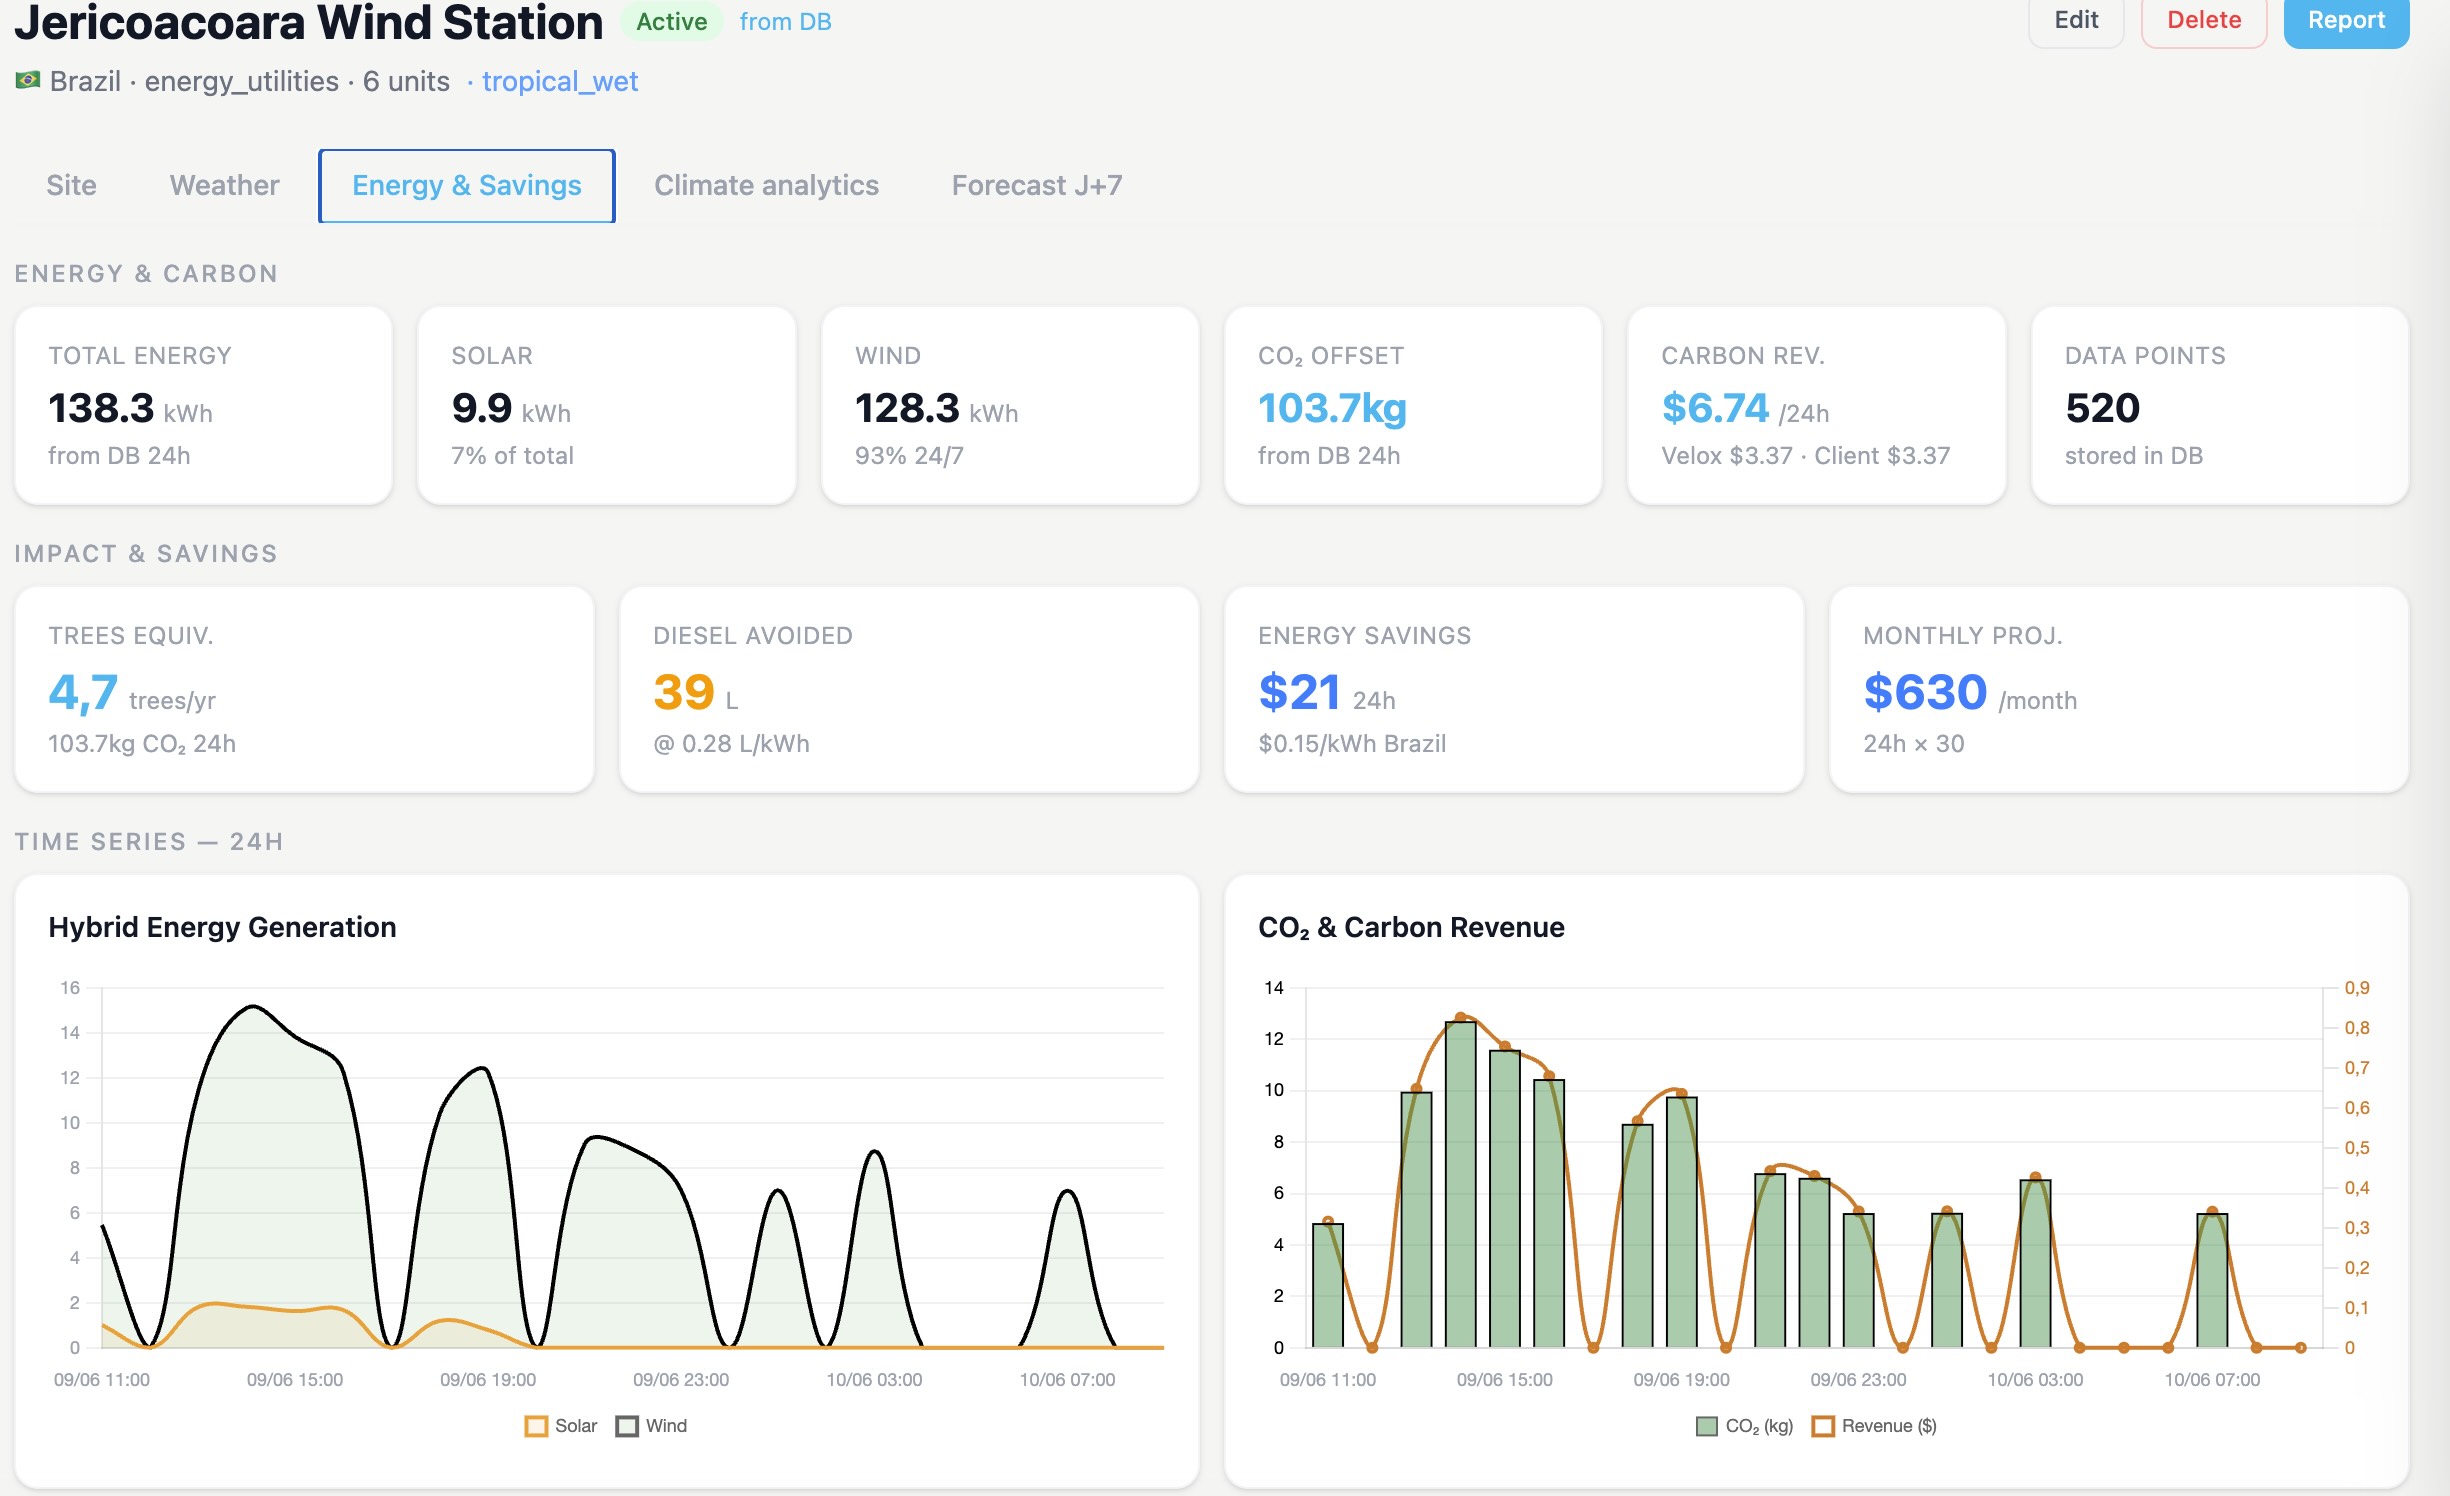
For infrastructure clients, the Energy & Savings tab tracks real-time production from Velox hardware (Aeroleaf, WindBush, WindPalm) — solar vs wind breakdown, CO₂ offset, diesel equivalent avoided and financial savings projected monthly.
Every kWh produced is a litre of diesel not burned. Jericoacoara Wind Station — 138 kWh in 24h, 39L diesel avoided, $630/month projected savings at Brazil grid rate.
Everything your team needs.
From alert to action.
Asset Health Score — AHS™
Every asset gets an AHS™ score updated hourly — Nominal, Monitor, Watch, Alert or Critical. Top 3 drivers explain what is pulling the score down. One recommended action tells your team what to do.
Guest Comfort — CCI™ & CDI™
For hospitality and public assets, CCI™ Climate Comfort Index and CDI™ Cooling Demand Index scored hourly. Anticipate cooling pressure 7 days ahead — before it hits the energy bill.
Energy Resilience — ERS™
ERS™ tracks energy coverage, battery autonomy, grid reliability and diesel dependency in one score. DFI™ Diesel Dependency Index flags critical situations before field intervention is needed.
Real-time alert management
10 climate alert types, GPS-calibrated to your climate zone. Email, SMS and WhatsApp notifications. Alert broadcast for municipalities. Full audit trail for regulatory reporting.
Climate Analytics & ERA5
The normality tunnel compares live conditions to 3-year ERA5 baselines — P10/P50/P90. Identify when conditions are anomalous vs historical norms. Available from Professional plan.
ESG & regulatory reporting
CSRD-aligned, TCFD-structured and IFRS 17 compatible climate risk reports. Auditable data lineage, documented methodology. PDF export in your organisation's branding.
Infrastructure map
Every deployed Velox unit mapped in real time — GPS location, active/inactive status, current kW output, last communication timestamp. Filter by site, by type, by status.
Multi-user & access control
Role-based access — admin, operator, viewer. SSO on Enterprise and Strategic tiers. Unlimited users on Enterprise. Full audit log for regulated environments.
Integrate climate intelligence
into your own systems.
Documented REST endpoints, JSON and CSV outputs, BigQuery-compatible exports. Query site-level or zone-level scores — AHS, WRI, FRI, CES, ERS and more — directly into your pricing engine, ERM platform or custom dashboards.
"site_name": "Jericoacoara Wind Station",
"ahs_score": 80,
"ahs_label": "Nominal",
"climate_zone": "tropical_wet",
"top_drivers": ["Fog Risk", "Cooling Demand"],
"action": "Standard monitoring — all systems nominal.",
"updated_at": "2026-06-10T07:00:00Z"
Built for operators and analysts alike.
Monitor asset health, track energy production and resilience, manage alerts and export ESG reports. From a wind station in Brazil to a solar park in Morocco.
Guest comfort scored hourly. Cooling demand forecast 7 days ahead. Climate alerts before conditions become hostile. AHS™ tells you when to act — not after the complaint.
BTS tower health scored 24/7. Sandstorm, lightning, wind and heat alerts. ERS™ tracks diesel dependency — DFI™ flags critical situations before field intervention.
WRI, FRI and CES indices for parametric triggers. Portfolio accumulation analytics. ERA5 historical baselines for underwriting enrichment and treaty pricing.
Automated CSRD and TCFD physical risk reports. Auditable data lineage. Climate exposure tracking across asset portfolios for fund-level ESG disclosure.
REST API with BigQuery-native exports. Integrate climate intelligence into custom pricing engines, ERM systems or internal analytics platforms. Full sandbox included.
From request to live dashboard
in under 24 hours.
Demo on your assets
within 48 hours.
Tell us your geographies and your vertical. We show you real scores on your specific locations.