For most of the last two decades, climate data lived in a specific drawer. You opened it once a year, extracted the figures your auditors needed, formatted them for CSRD or TCFD, and closed it again. The data was largely modelled, occasionally measured, and almost never acted upon in real time.
That drawer is being dismantled. Not because reporting has lost its importance — it has become more demanding, not less. But because the underlying data has changed in nature. When climate signals are captured continuously, at site level, and processed into structured indices, they stop behaving like compliance indicators. They start behaving like operational intelligence.
The question is no longer whether to collect climate data. It is whether the data you collect is granular enough, timely enough and grounded enough to support decisions — not just reports.
The Compliance Era and Its Limits
The first generation of climate dashboards was designed around a single objective: satisfy the auditor. Data was annual, aggregated, and drawn primarily from regional meteorological sources or sector benchmarks. The chain between measurement and decision was long enough that by the time a risk signal appeared in a report, it had already manifested as a loss, a claim, or an operational disruption.
This approach had a rational basis when continuous data collection was expensive and connectivity was limited. It no longer does. The cost of deploying calibrated environmental sensors has fallen by an order of magnitude. Connectivity is near-universal even in remote geographies. And the regulatory frameworks themselves — IFRS 17, CSRD, TCFD — are now explicitly requesting site-level, verifiable, continuously updated data rather than modelled proxies.
The compliance era produced dashboards that looked backward. The question now is what a forward-looking climate intelligence system actually looks like — and what it can do that its predecessor could not.
What Shifts When Data Becomes Continuous
The transition from periodic to continuous data is not merely a technical improvement. It changes the category of questions that climate intelligence can answer.
From "what happened?" to "what is happening?"
Continuous data enables real-time situational awareness. An underwriter pricing a wildfire parametric product does not need to know what the average WRI was last quarter. They need to know what it is now, on the specific site in question, and how it has trended over the past 72 hours. That is a different data requirement — and a different kind of platform.
From "what is our exposure?" to "where is exposure concentrating?"
Portfolio-level risk management changes character when data is continuous. An insurer with hourly FRI and WRI readings across 500 insured assets can identify accumulation before events materialize — adjusting coverage, pre-positioning loss adjusters, or triggering parametric payouts automatically when thresholds are crossed.
From "what did it cost?" to "what will it cost, and when?"
Continuous field data feeds predictive models in a way that point-in-time data cannot. A BigQuery ML model trained on 18 months of ground-truth signals can identify the environmental precursors to equipment failure, claims spikes, or operational disruptions — days or hours before they become visible to traditional monitoring systems.
Compliance data answers: what happened?
Operational intelligence answers: what is happening?
Predictive intelligence answers: what will happen, and where?
Each step requires not just better data, but data that is continuous, localized and structured into actionable indices.
The Underwriting Case
Nowhere is the shift from compliance to command more consequential than in insurance and reinsurance. The parametric trigger problem is fundamentally a data quality problem.
A parametric contract requires a threshold to be crossed at a verifiable location. The reliability of that contract — and the basis risk embedded in it — depends entirely on how accurately and continuously the triggering index is measured. A Wildfire Risk Index calculated from a distant airport station with 48-hour latency is not a reliable parametric trigger. A WRI calculated from a calibrated ground node updated every hour, GPS-classified to the precise climate zone of the insured asset, is.
The difference is not marginal. It determines whether a parametric product actually performs its primary function — paying out when a loss occurs, and not paying when it does not — or whether it generates the disputes and litigation that have slowed the growth of the parametric market for a decade.
Three things continuous ground-truth data enables for underwriters
- Tighter trigger design. Site-level, hourly data allows triggers to be calibrated to actual exposure rather than regional proxies, reducing basis risk and improving product reliability.
- Dynamic pricing. Real-time risk indices enable risk-adjusted pricing that reflects current conditions rather than historical averages — an advantage in markets where climate volatility has decoupled from historical loss patterns.
- Automated settlement. When triggers are objective and verifiable, settlement can be automatic — no loss adjusters, no disputed assessments, no delays. This is the core value proposition of parametric insurance, and it requires data that can support it.
The Infrastructure Operator Case
For operators of distributed physical infrastructure — rail networks, telecom towers, power grids, port facilities — the shift to continuous climate data has a different but equally significant impact.
The traditional maintenance model is calendar-based: you intervene at fixed intervals regardless of actual conditions. It is predictable and auditable, but it is systematically inefficient. It generates unnecessary interventions on assets that are performing well, and it misses the anomalies that precede failures between intervention cycles.
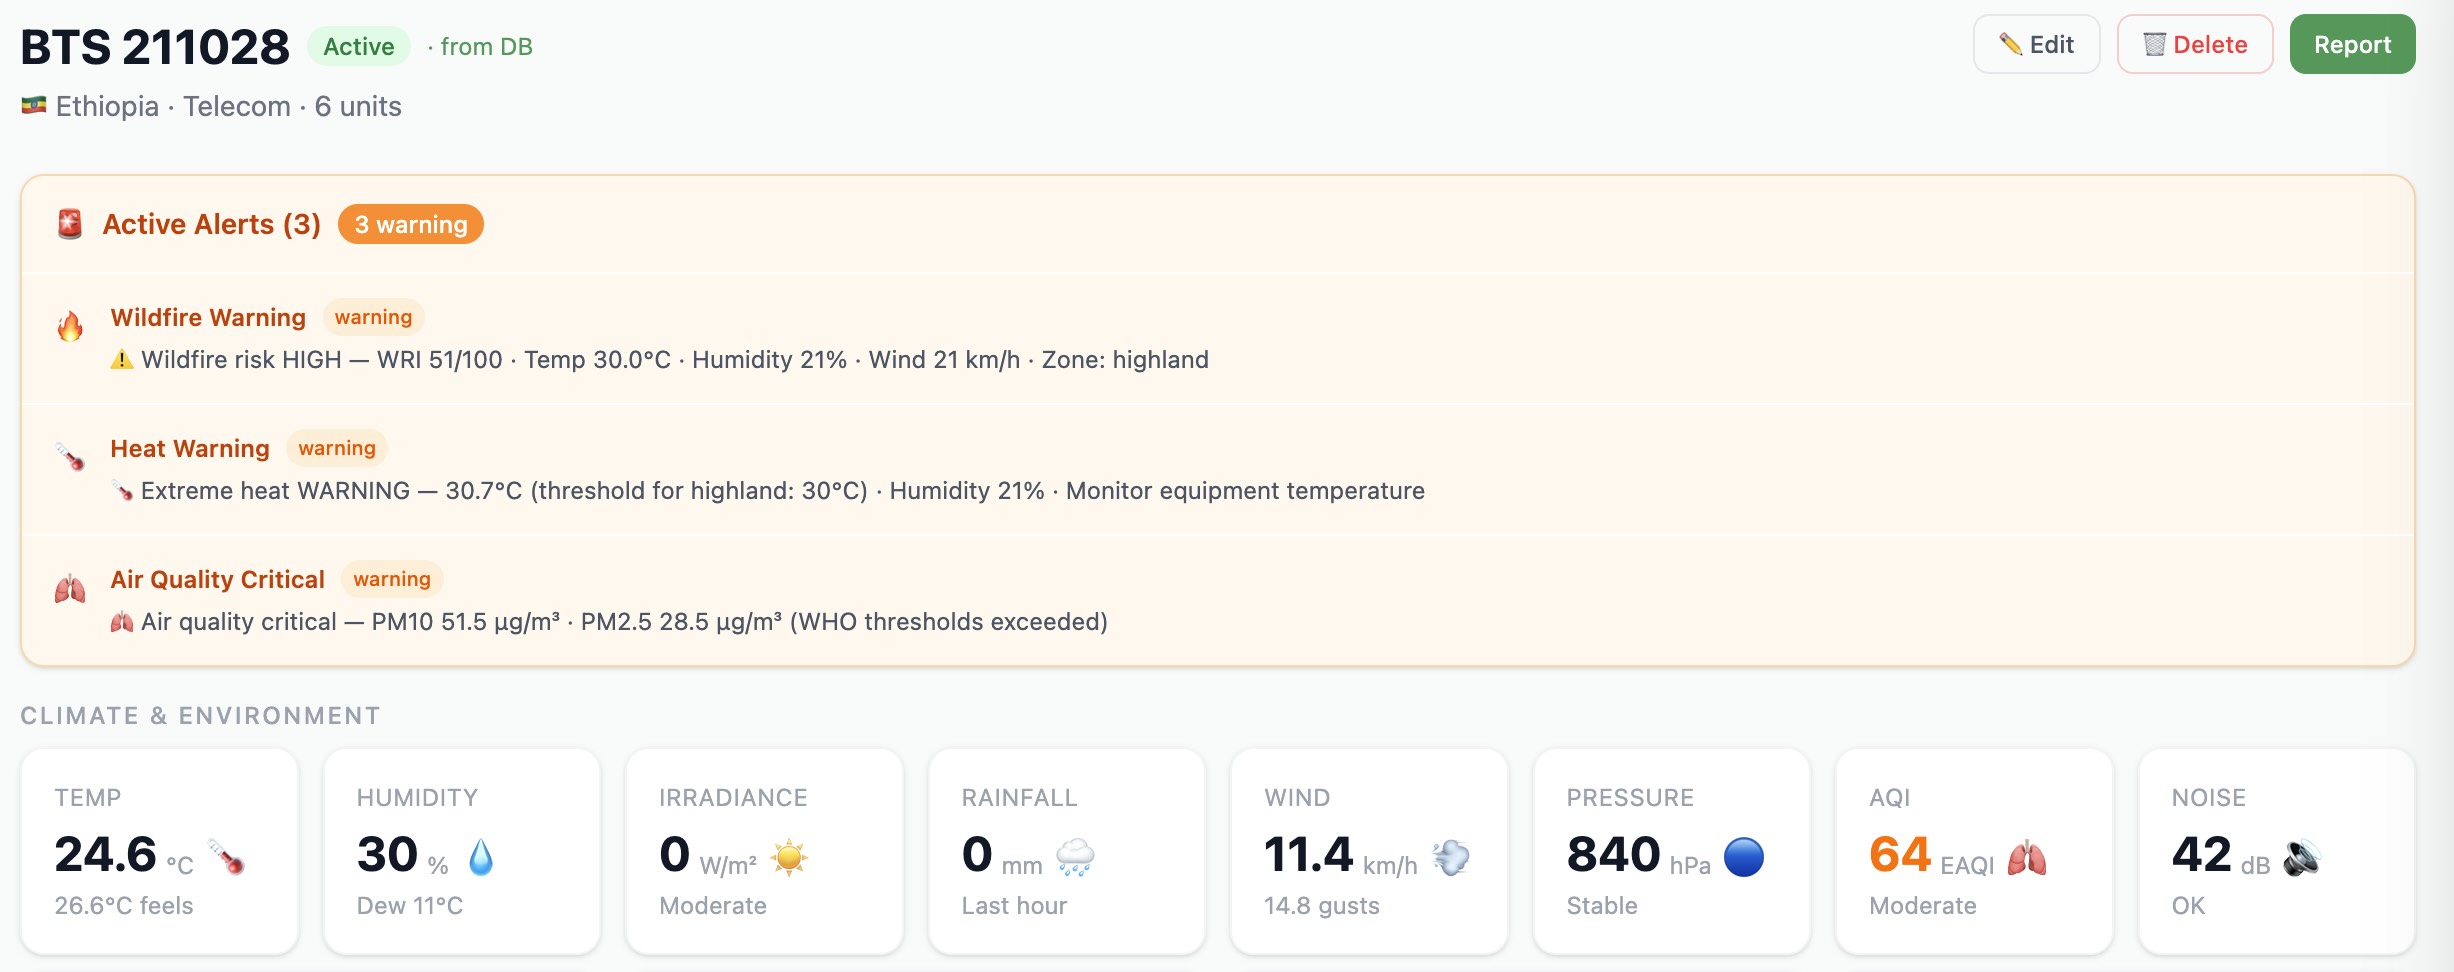
Continuous environmental data enables a condition-based maintenance model. When you have hourly readings of wind speed, temperature, humidity, particulate matter and corrosion exposure for every asset in your network, you can identify the environmental signatures that precede equipment stress — and intervene before failure rather than after.
For a portfolio of 300 telecom towers across West Africa and the Middle East, the difference between calendar-based and condition-based maintenance can represent tens of millions of euros in avoided downtime and emergency logistics costs annually.
Beyond maintenance: the accumulation view
Operators managing large asset networks face a second challenge that continuous data uniquely addresses: understanding where climate exposure is concentrating across their portfolio. A corrosion exposure index that is elevated across 40 coastal sites simultaneously is a different risk profile than the same reading isolated to three sites. Continuous, network-wide data makes that distinction visible — and actionable — in real time.
The Data Layer as a Strategic Asset
There is a dimension of continuous climate data that is easy to underestimate: it appreciates over time. A dataset that has been continuously collected for 18 months is structurally more valuable than one collected for 3 months — not because the recent data is different, but because the longitudinal depth enables pattern recognition that shorter datasets cannot support.
This has important implications for competitive positioning. Organizations that begin building a ground-truth climate data layer today are not simply improving their current risk management capabilities. They are building a proprietary dataset that will support increasingly precise predictive models as it deepens — and that competitors cannot replicate simply by connecting to the same data vendor.
- Longer time series → more accurate seasonality adjustment
- Denser geographic coverage → better spatial interpolation and accumulation detection
- Higher frequency → finer-grained precursor identification for predictive models
- Broader peril coverage → cross-peril correlation analysis unavailable from single-peril datasets
What Good Operational Climate Intelligence Requires
Not all climate data platforms deliver the shift from compliance to command. The distinction between a reporting dashboard and an operational decision tool comes down to five properties.
Continuity
Data must update at operational frequency — hourly as a minimum for most use cases, with real-time capability for parametric triggers and emergency response applications. Annual or quarterly data cannot support operational decisions regardless of its accuracy.
Ground-truth grounding
Data must originate from physical measurement at or near the asset, not from regional models or distant stations. The operational relevance of a climate signal is directly proportional to its spatial proximity to the site it describes.
Climate-zone calibration
Thresholds and indices must be adapted to the actual climate context of each site. A Heat Stress Index calibrated to a temperate European baseline is not meaningful for an asset in the Sahel or the Arabian Peninsula. GPS-based climate zone classification is the foundation of accurate, context-sensitive alerting.
Structured index delivery
Raw sensor readings are not operational intelligence. The value is in the structured indices — WRI, FRI, Heat Stress, Corrosion Exposure — that translate physical measurements into decision-relevant signals. These indices must be documented, reproducible and auditable to support both operational decisions and regulatory disclosure.
API-first integration
An operational climate intelligence platform is only valuable to the extent that it integrates with the systems where decisions are made: pricing engines, ERM platforms, CMMS, ESG reporting tools. API-first architecture is not a feature — it is a prerequisite for operational relevance.
The Window That Is Open Now
The shift from compliance to command is not a future event. It is underway. The insurers designing parametric products with ground-truth triggers, the infrastructure operators building condition-based maintenance programs on continuous environmental data, the real estate managers integrating site-level climate scores into acquisition underwriting — they are building capabilities today that will be structurally difficult to replicate in three years.
The window is open because the technology is ready, the regulatory pressure is aligned, and the competitive advantage of acting early is still available. Climate intelligence built on continuous, localized, ground-truth data is not yet the standard. It will be.
Organizations that integrate this layer today are not just improving current risk management. They are building a data asset that appreciates as it accumulates — and a decision capability that compounds as models improve.